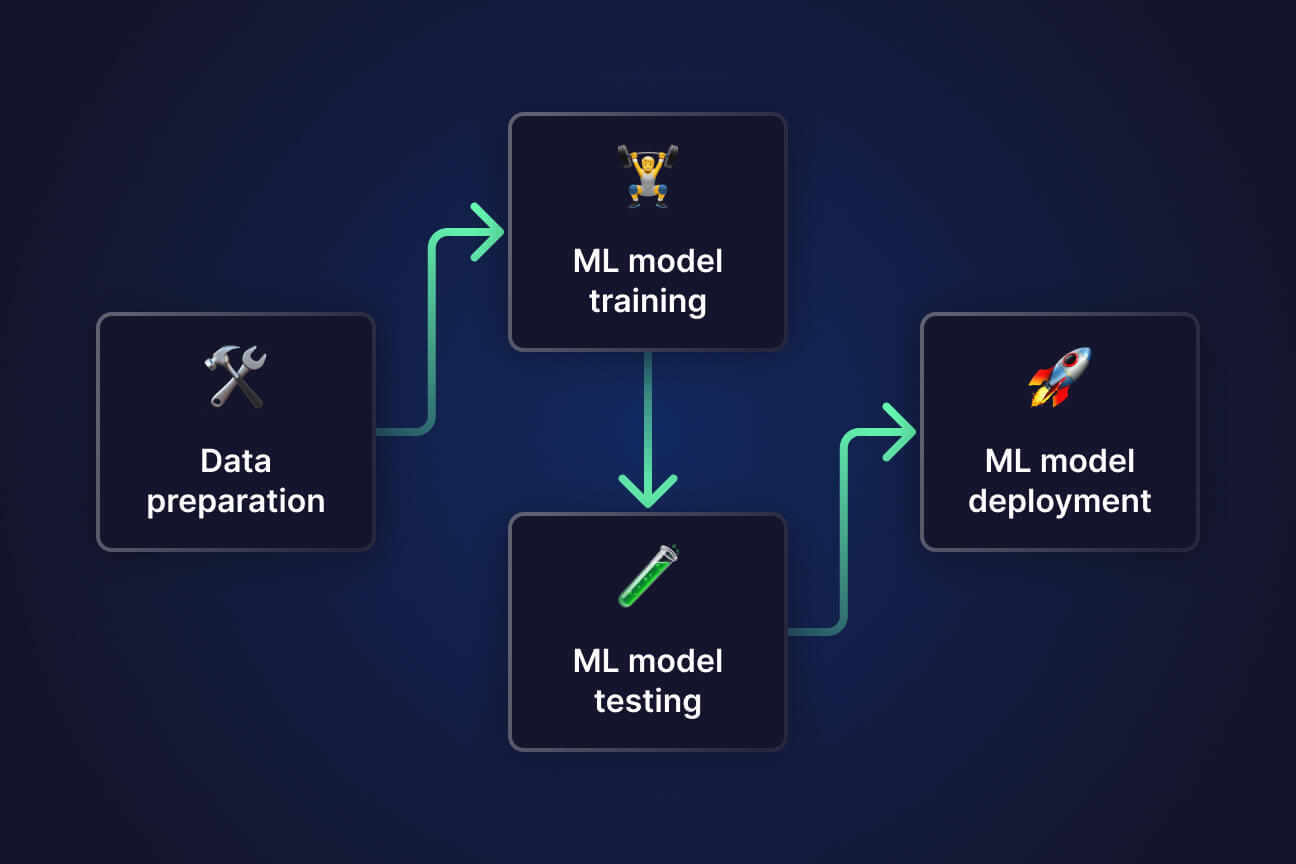
In the world of analytics, raw data often resembles an uncut gemstone—rough, flawed, and far from its true brilliance. Just as a jeweller shapes and polishes a raw diamond through precise, deliberate steps, data scientists refine unprocessed data into reliable insights through structured cleaning pipelines. This process isn’t a single swipe of a polishing cloth; it’s a careful choreography of transformations, validations, and corrections that convert chaos into clarity.
The Art of Transformation: Seeing Data as Clay
Imagine working with a block of clay. At first, it’s formless and unrefined. You don’t sculpt a masterpiece in one go—you mould, smooth, and reshape until it reflects the desired form. Data cleaning follows a similar philosophy. It’s not about erasing imperfections outright but understanding their origin and impact before applying a fix.
A multi-stage data cleaning pipeline ensures that transformation occurs in logical steps—each addressing a distinct problem. Whether dealing with missing entries, inconsistent formats, or duplicate records, the process unfolds systematically. Learners pursuing a Data Analytics course in Kolkata often find this stage the most rewarding because it’s where messy datasets begin to reveal their structure and meaning.
Stage One: Detection – Listening to What the Data Whispers
Before any transformation comes understanding; this is the stage where analysts put on their detective hats. They listen to what the data is trying to say through exploratory analysis, including summary statistics, data profiling, and anomaly detection. Patterns emerge: a date column that flips between DD/MM/YYYY and MM/DD/YYYY. This customer field alternates between upper and lower case, or a column full of nulls, hinting at missing logs.
Visualisation plays a key role here. Graphs, histograms, and scatter plots expose outliers and irregularities. The goal is to sense the rhythm of the dataset—to know where it flows smoothly and where it stumbles. A seasoned analyst knows that each inconsistency tells a story—one of system migrations, human errors, or integration oversights. This stage isn’t about judgment; it’s about discovery.
Stage Two: Standardisation – Bringing Harmony to the Orchestra
Once detection is complete, it’s time to tune the instruments. Data from different sources rarely sing in harmony. Date formats, units of measurement, text capitalisation, and categorical values often vary across systems. Standardisation acts like a conductor, ensuring every element plays in sync.
For example, converting “Yes/No” and “Y/N” responses into a uniform binary format brings consistency to categorical fields. Similarly, normalising currency values or units like “kg” and “pounds” ensures comparability. Standardisation doesn’t just make analysis easier—it prevents costly misinterpretations.
Students of a Data Analytics course in Kolkata quickly learn that automation tools—like Python’s Pandas library or Apache Spark—make standardisation scalable. But even with tools, human oversight remains vital. Technology handles the “how”; it’s the human analyst who decides the “why” and “when.”
Stage Three: Deduplication – Filtering the Echoes
In the vast expanse of data, duplication is inevitable. Customer records, transaction logs, or survey responses often get entered multiple times under slightly different details. Deduplication ensures that these echoes don’t distort the melody of the dataset.
This process involves fuzzy matching, string similarity checks, and key-based comparisons. But what makes it fascinating is the balance between precision and flexibility. Remove too aggressively, and you risk deleting legitimate data; act too cautiously, and duplicates remain. Successful deduplication demands intuition—a sense of when two seemingly different entries are actually the same.
Stage Four: Imputation and Correction – Filling the Gaps Gracefully
No dataset is perfect. Missing values, incorrect entries, and anomalies creep in despite best efforts. Imputation techniques—mean substitution, regression-based estimation, or model-driven filling—allow analysts to make educated guesses. But the secret lies in knowing which technique suits the data’s nature.
For instance, imputing a missing “age” using a median makes sense, while guessing a missing “address” might require reference from other fields. It’s an act of informed restoration rather than random patching. Correction, meanwhile, focuses on rectifying logical inconsistencies—like ensuring that “Order Date” always precedes “Delivery Date.”
At this stage, the dataset begins to resemble a well-balanced sculpture. Each adjustment enhances integrity without compromising authenticity.
Stage Five: Validation and Monitoring – The Final Quality Check
The last stage is like running a quality inspection before a product hits the market. Validation confirms that every transformation performed earlier has improved—not degraded—the dataset’s reliability.
Rules are tested: Are there still null values? Are numerical ranges valid? Do foreign keys align with primary tables? Automated test scripts can flag issues, but the human eye still makes the final judgment. Data cleaning isn’t a one-time ritual; it’s an ongoing process. In real-world systems, new data arrives constantly, making continuous monitoring essential.
Building alerts or dashboards that detect data drifts ensures sustained quality. The best pipelines evolve with time, adapting to new sources and business requirements, much like a musician continually refining their craft.
The Human Element Behind the Pipeline
While technology can automate much of this process, it’s the human analyst who gives it direction. The best data cleaning pipelines are built on both logic and empathy—the ability to see data not just as numbers but as traces of real-world activity.
A marketing dataset might represent customer journeys; a hospital record, a patient’s story. Understanding this context shapes every decision about what to correct, what to retain, and what to discard. This empathy-driven approach transforms data cleaning from a mechanical task into a mindful discipline.
Conclusion: The Symphony of Clean Data
A well-designed multi-stage data cleaning pipeline is more than a technical achievement—it’s an artistic one. Each stage plays its part in transforming scattered, noisy information into a coherent symphony of insight. From detection to validation, every step polishes the data until it reflects accuracy, consistency, and meaning.
Just like a jeweller perfecting a diamond’s facets or a sculptor shaping clay into form, the data analyst’s craft lies in patience, precision, and vision. The outcome? Data that’s not only clean but truly luminous—ready to guide sound decisions and inspire innovation.
For anyone aspiring to master this craft, a structured learning experience through a Data Analytics course in Kolkata offers the perfect gateway to understanding how messy data evolves into strategic intelligence—one transformation at a time.